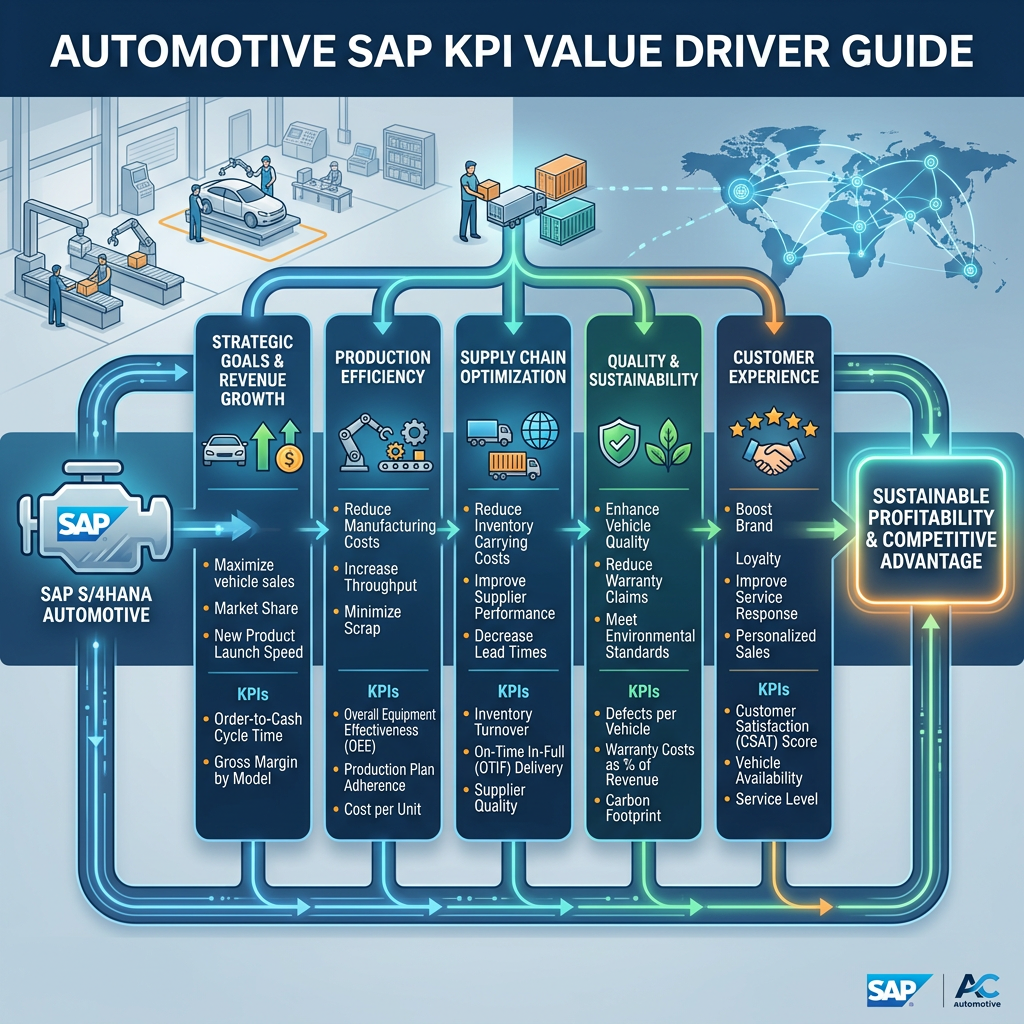
If you’re a project manager (PM) leading an SAP S/4HANA implementation at an automotive Tier 1 supplier, you’ve probably run into this problem: the KPIs on your dashboard don’t explain themselves to the steering committee, and nobody can quite say which lever the project is actually supposed to pull to create that result. That gap almost always comes down to one thing—Business Driver, Business Value Driver, and Business KPI are being used interchangeably when they are, in fact, three distinct concepts with three distinct jobs.
This guide untangles the three terms, shows how they connect using SAP’s own Value Driver Tree logic, and walks through concrete Business Value Driver-to-KPI mappings for automotive Tier 1 manufacturing—so you can drop them straight into your project charter, business case, and steering committee deck.
Why PMs Need to Separate These Three Terms
In most SAP programs, requirements gathering moves forward while “Driver,” “Value Driver,” and “KPI” stay loosely defined and get used as synonyms. The result shows up later, when leadership asks a simple question—”so what did this actually achieve?”—and the project team can’t draw a clean line from the work delivered to the value created. Getting the definitions straight at the outset prevents that.
1. Three Terms, Three Jobs
Business Driver (the TOGAF® definition)
The Open Group’s TOGAF® standard, the global reference framework for enterprise architecture, defines a Driver as:
“An external or internal condition that motivates the organization to define its goals.”
(TOGAF Content Metamodel)
Regulatory change, the shift to EVs, frequent revisions to OEM delivery call-offs—these are the external and internal conditions that push an organization to act. A Driver is not a number. It’s the context that motivates the goal.
Business Value Driver (the value-based management definition)
Business Value Driver comes from a different tradition: value-based management and SAP Analytics Cloud’s Value Driver Tree functionality. It refers to a controllable, quantifiable factor that actually moves enterprise value or a KPI.
“This means you need to consider seven value drivers – macro level factors that, for most industries, determine shareholder value.”
(SAP Help: Understand What Drives Value)
Product price, headcount, raw material cost, machine utilization—these are the variables a PM can actually influence through the program.
“The drivers are usually figures that you can influence directly, like product prices, headcount, or travel expenses. They could also be external factors such as tax rates or raw material costs.”
(SAP Help: Set Up Value Driver Trees for Planning)
Business KPI (the Measure)
A KPI tracks whether the Driver or Value Driver is actually working.
“An indicator or factor that can be tracked, usually on an ongoing basis, to determine success or alignment with objectives and goals.”
(TOGAF Content Metamodel)
Quick Reference Table for PMs
| Term | What it represents | Example | Where it belongs in your project |
| Business Driver | The background/motivation for change | EV transition, frequent OEM call-off changes, tightening regulation | Project charter — “background and objectives” |
| Business Value Driver | A controllable numeric factor that moves enterprise value | Product price, machine utilization, direct material cost, days in inventory | Business case — “value driver” section |
| Business KPI | The metric that measures progress toward the goal | OTD, OEE, inventory turnover, BOM accuracy | Steering committee reporting, benefits realization tracking |
2. How Business Value Drivers and KPIs Connect: The Value Driver Tree
A Value Driver Tree is a hierarchical model that decomposes a top-line business outcome into the operational factors that produce it.
“A value driver tree (also called a driver tree or value tree) is a hierarchical model that decomposes a high-level business outcome into the operational factors that produce it. The outcome sits at the root. Each level below it breaks the parent into its component drivers, continuing until every branch terminates at a lever that someone in the organisation can directly act on.”
(KPI Tree: Value Driver Tree)
SAP Analytics Cloud implements the same logic natively—rather than staring at isolated KPIs, you see the whole value chain in one view.
“Use a value driver tree (VDT) in SAP Analytics Cloud to visualize the entire value chain of your business, instead of looking at isolated KPIs.”
(SAP Help: Set Up Value Driver Trees for Planning)
The structure looks like this:
Business Value Driver (controllable factor)
e.g., manufacturing lead time, direct material cost, utilization rate
↓ influences
Business KPI (outcome metric)
e.g., OTD, total manufacturing cost, inventory turnover
↓ rolls up into
Enterprise KPI (financial outcome)
e.g., net revenue, gross margin, EBIT
For PMs, the operative insight is this: you can only directly control the Value Driver. Leadership only cares about the KPI and the financial outcome. Every workstream and every task in your WBS should be traceable to a specific Value Driver, which in turn maps to a specific KPI, which in turn rolls up into a specific financial result. If you can’t draw that line, the workstream needs to be re-scoped or re-justified.
3. Concrete Business Value Driver-to-KPI Mapping for Automotive Tier 1
SAP’s own S/4HANA Value Starter methodology uses an automotive OEM case study (“eByke Motors”) and explicitly names real-world Tier 1 automotive component suppliers as reference peers who realized business value through S/4HANA.
“Your peers – Osram Continental, Volkswagen Sachsen, Minda Industries – have realized business value through S/4HANA”
(SAP S/4HANA Value Starter Engagement Result Document)
Mapping the four Value Drivers from that framework onto automotive Tier 1 manufacturing, procurement, and logistics functions:
| Business Value Driver | Automotive Tier 1 KPI / Initiative | Related SAP Solution Capability |
| Accelerate revenue growth | “Reduce time to market for new products by creating dramatic efficiencies that accelerate innovation and expedite production operations” | Manufacturing Engineering |
| Accelerate revenue growth | “Reduce order fulfillment lead time by managing vehicle distribution and accelerating sales fulfillment” | Vehicle Sales & Distribution Management |
| Cost control & margin improvement | “Reduce total manufacturing cost by streamlining all pre-and post-production process steps, down-and wait-times are reduced” | Production Execution |
| Cost control & margin improvement | “Improve sourcing savings on direct spend by increasing buying power by bundling purchase requirements across the organization” | Central Purchasing |
| Cost control & margin improvement | “Reduce asset maintenance cost by implementing preventive or condition-based maintenance strategies” | Maintenance Execution |
| Improve asset efficiency | “Reduce unplanned downtime or outages by providing easy access to all details required to manage malfunctions on mobile devices” | Maintenance Execution |
| Better manage liabilities | “Reduce days in inventory by allocating vehicles to fulfill dealer orders” | Vehicle Sales and Distribution |
| Better manage liabilities | “Reduce days sales outstanding by taking a strategy-based approach to prioritizing customers for collections activities” | Collections Management |
| Supply chain resilience | “Improve demand forecast accuracy by allowing sales and supply chain planners to collaborate effectively” | Demand Planning for Configurable Products |
| Supply chain resilience | “Reduce revenue loss due to stock-outs by replenishing inventory based on customer demand and reducing shortages across the supply chain” | Demand-Driven Replenishment |
| Industry-standard delivery KPI | “Improve On-Time Delivery Performance” | — |
(Source: SAP S/4HANA Value Starter Engagement Result Document)
Connecting to Industry-Standard KPIs (Odette LK03)
Beyond company-specific KPIs, OEM-supplier relationships also run on shared industry benchmarks.
“Common indicators will facilitate understanding between business partners, align with the requirements of Global MMOG/LE and support risk management.”
(Odette LK03: KPIs for Automotive SCM)
And every KPI you define should pass the SMART test.
“KPIs should follow the SMART principle, i.e.: Strategic Measurable Achievable Realistic Timely.”
(Odette LK03: KPIs for Automotive SCM)
Common formula-based KPIs used across the industry:
| KPI | Formula | Source |
| Inventory Turnover | Recognized revenue ÷ average inventory | SAP Help |
| OEE | Availability × Performance × Quality | Brickclay |
| On-Time Delivery (OTD) | (Orders delivered on time ÷ total orders) × 100% | Brickclay |
| Supplier OTIF | (On-time and in-full deliveries ÷ total deliveries) × 100% | Brickclay |
4. A Five-Step Playbook PMs Can Apply Directly
Step 1 — Name the Business Driver in TOGAF Phase A
At kickoff, put the “why” of the SAP program into writing.
“In TOGAF® Phase A, the process includes: Identifying business goals / Understanding business drivers / Analyzing stakeholder concerns / Defining value propositions / Establishing KPIs”
(eaviaer.com: SAP PLM KPI Design for Tier 1 Automotive Suppliers)
Step 2 — Identify Business Value Drivers in the Business Case
Follow SAP’s own Value Starter approach: go from strategic priorities to specific, quantifiable value drivers, then build the financial case.
“Define your priorities — Strategic objectives — Identify Improvements — Key value drivers & scenarios — Build the Case — Assessing the incremental financial benefit — Plan the Change”
(SAP S/4HANA Value Starter Engagement Result Document)
Step 3 — Design a Three-Layer KPI Hierarchy
Don’t report a single flat KPI list. Split it by audience—executive, transformation, and execution—so each stakeholder sees the right level of detail.
“In Phase A, focus on high-level business and transformation KPIs.” “Detailed operational KPIs should be refined in later phases.” “A multi-layer KPI structure ensures consistency and alignment.”
(eaviaer.com)
| Layer | Audience | Example KPIs |
| Business Level | Executive sponsors | SOP lead time, profit margin, audit findings |
| Transformation Level | Program owner / PMO | Engineering change cycle time, BOM accuracy |
| Execution Level | Delivery teams / system operations | Master data compliance rate, system adoption rate |
Step 4 — Run What-If Scenarios with a Value Driver Tree
Use a tool like SAP Analytics Cloud to model, for example, how a 5% improvement in machine utilization would ripple through to inventory days and EBIT—turning it into a data-backed basis for prioritization and investment decisions.
“A value driver tree lets you visualize these different links and see how your changes affect the bottom line.”
(SAP Help: Set Up Value Driver Trees for Planning)
Step 5 — Track KPIs Continuously Through Benefits Realization
Don’t let measurement stop at go-live. Keep monitoring KPIs post-implementation to confirm the investment in each Value Driver is actually translating into the promised KPI and financial outcome—this is how you avoid the “we implemented it, but we can’t prove the value” trap.
PM Checklist (Copy Directly into Your Project Documentation)
- Does the project charter clearly state the Business Driver (the “why” behind the program)?
- Does the business case name specific, controllable Business Value Drivers (price, utilization, cost, inventory days, etc.)?
- Is the causal chain from Value Driver → KPI → financial outcome documented and visualized?
- Are KPIs organized into Business / Transformation / Execution layers?
- Does every KPI definition satisfy the SMART criteria (Strategic, Measurable, Achievable, Realistic, Timely)?
- Are internal KPIs reconciled with the industry-standard KPIs (OTD, OTIF, etc.) used in your OEM contracts?
- Does your benefits realization plan define how each KPI will be monitored after go-live?
Summary
Business Driver, Business Value Driver, and Business KPI answer three different questions—why are we changing, what are we actually moving, and how do we know it’s working—and a successful automotive Tier 1 SAP program depends on keeping all three explicit and causally linked. Business Driver captures the external or internal condition motivating the initiative. Business Value Driver is the controllable, quantifiable lever—price, utilization, cost, inventory days—that a PM can actually pull. Business KPI is the metric that proves the lever is working, rolling up into the financial outcomes leadership actually cares about. By embedding this chain into your project charter, business case, steering committee reporting, and benefits realization plan, you give your SAP program a defensible, data-backed story from day one—and you make sure that when someone eventually asks “so what did this achieve?”, you already have the answer.
References
- TOGAF Content Metamodel
- TOGAF Driver/Goal/Objective Catalog
- SAP Help: Understand What Drives Value
- SAP Help: Set Up Value Driver Trees for Planning
- SAP S/4HANA Value Starter Engagement Result Document
- KPI Tree: Value Driver Tree
- eaviaer.com: SAP PLM KPI Design for Tier 1 Automotive Suppliers
- Odette LK03: KPIs for Automotive SCM
- Brickclay: Top 15 Automotive KPIs
- SAP Help: KPI Inventory Turnover
- Capgemini: SAP S/4HANA for Automotive Suppliers
Disclaimer
Parts of this article were developed with reference to generative AI suggestions and were reviewed, refined, and supplemented based on the author’s professional expertise and judgment.

Leave a Reply