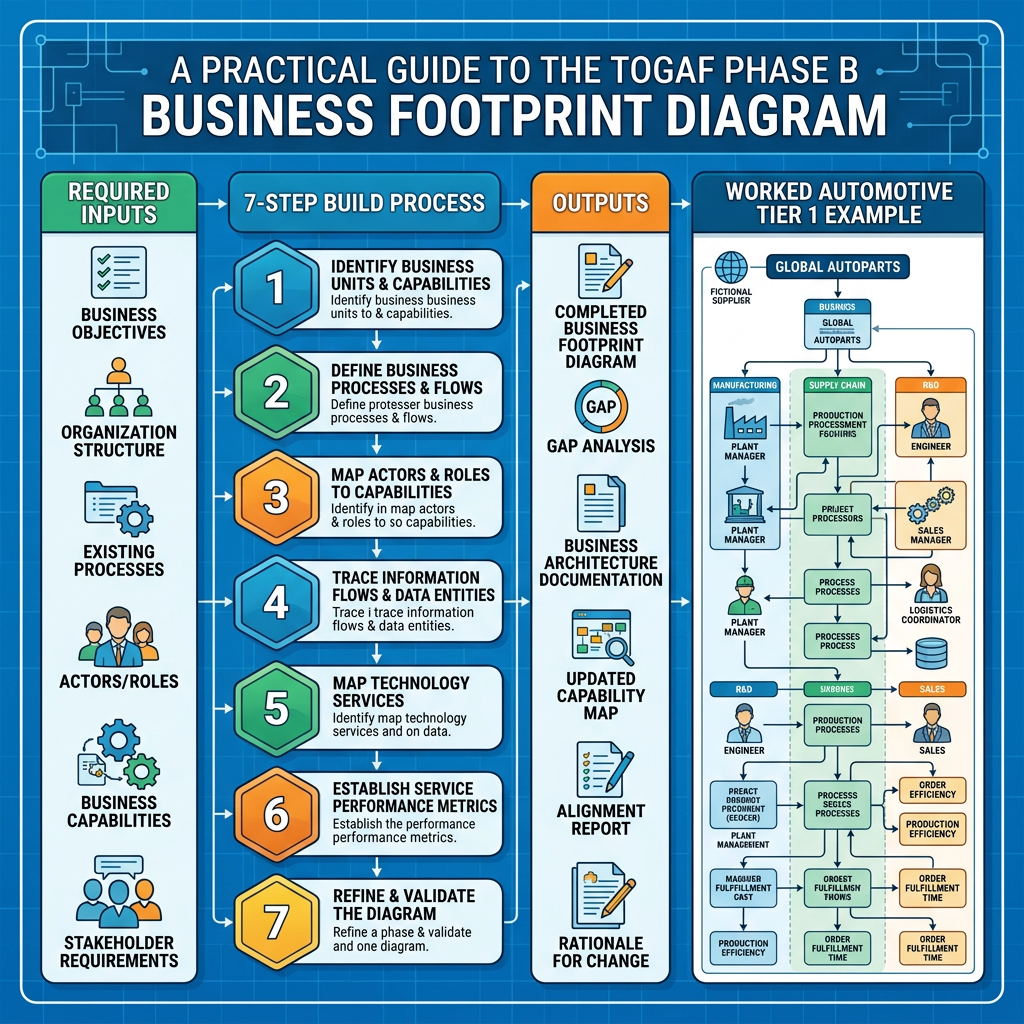
Of all the artifacts in TOGAF® ADM Phase B, the Business Footprint Diagram (BFD) is the one that lands hardest with executives — and the one most often drawn carelessly. This guide breaks the artifact down to a level an Enterprise Architect can act on immediately: the prerequisites you must gather (INPUT), the step-by-step method for building it (PROCESS), the deliverables and where they get used (OUTPUT), and a fully worked example set in a global automotive Tier 1 S/4HANA transformation.
1. What a Business Footprint Diagram Actually Is
The Open Group defines it this way:
A Business Footprint diagram describes the links between business goals, organizational units, business functions, and services, and maps these functions to the technical components delivering the required capability.
(The Open Group, Artifact: Business Footprint Diagram)
Two further points matter just as much:
- It provides clear traceability between a technical component and the business goal it satisfies, while also demonstrating ownership of the services identified (The Open Group).
- It shows “only the key facts” and serves as a communication platform for senior-level (CxO) stakeholders (The Open Group).
The artifact belongs to Phase B:
The business footprint diagram is built during Phase B: Business Architecture of the TOGAF® ADM. It provides a high-level view of the people and technologies involved with key business functions.
(UNICOM System Architect documentation)
SAP describes it as an “x-ray”-like visualization running from goals and objectives down to applications and technologies — in other words, a cross-domain view (SAP Learning, Defining Business Architecture).
Common Misuses
| Misuse | Why it fails |
| Drawing detailed business process flows | A BFD carries key facts only; process detail belongs in a Process Flow Diagram |
| Listing applications with no vertical linkage | Break the chain to goals and the diagram becomes useless for investment decisions |
| Omitting owners | The standard explicitly calls for “ownership of the services identified”; without it, decision-makers cannot decide |
| Cramming the whole enterprise onto one page | Readability for CxOs collapses — scope it and split into multiple views |
2. INPUT: What You Need Before You Draw
A BFD is a composite artifact. You cannot produce it in isolation. Tool implementation guidance is explicit about what must already be defined:
Business Services / Organizational Function / Business Goal / Logical Technology Components / Organizational Unit / Physical Technology Components / Technology component
(UNICOM System Architect)
Those elements must also already be related to one another through the following matrices (same source):
- Goal to Organization Unit
- Organization Unit owns Functions
- Organization Unit owns Business Services
INPUT Checklist (Practitioner Version)
| # | INPUT | Source | Fallback if missing |
| 1 | Strategic goals, objectives, value drivers | Phase A Architecture Vision; Driver/Goal/Objective Catalog | Extract KPIs from the corporate or mid-term plan and flag as provisional |
| 2 | Organizational units and locations | Organization/Actor Catalog; Location Catalog | Org chart plus site list |
| 3 | Business functions and capabilities | Business Service/Function Catalog; Business Capability Map | Industry reference models such as the SAP Reference Business Architecture |
| 4 | Business services and their owners | Organization Unit owns Business Services matrix | Process owner register, RACI |
| 5 | Logical and physical technology components | Existing Phase C/D assets; application portfolio | CMDB, license register |
| 6 | Scope definition | Statement of Architecture Work; Request for Architecture Work | Steering committee decision memo |
| 7 | Stakeholders and their concerns | Stakeholder Map Matrix | Interview notes |
The scope of Phase B is “primarily determined by the Architecture Vision as set out in Phase A,” so starting a BFD before items 1 and 6 are settled guarantees rework (SAP Learning).
Judging Input Quality (Definition of Ready)
- Are the goals measurable? (“Direct material cost down 3% year on year,” not “reduce procurement cost”)
- Does every business service have a named owner? A department name alone is not enough.
- Is capability granularity consistent across two to three levels?
- Are applications identified down to official name, version, and deployment site?
3. PROCESS: A Seven-Step Build Method
Step 1: Fix the scope and the layer structure
SAP sets out the layers a BFD typically shows (SAP Learning):
- Organization Units, explaining the scope of the architecture design
- Strategic Goals and Objectives (value drivers)
- Business Processes
- Business Capabilities
- Solution Components
- Required Technology Capabilities
- Locations
The same source notes that layer selection is discretionary but “must adhere to established top-down hierarchical relationships.” You may drop layers; you may not break the top-down chain.
Four to six layers works best. Goal → Capability/Function → Business Service → Solution Component is the most broadly applicable four-layer pattern.
Step 2: Put three to five goals on the top row
Because the audience is the C-suite, keep goals tight. Attaching a KPI and a target value to each one makes the downstream investment conversation dramatically easier.
Step 3: Link goals to organizational units
Use the Goal to Organization Unit matrix to settle who is accountable for each goal (UNICOM System Architect). Any goal with a blank owner is an issue to escalate before it goes on the diagram.
Step 4: Place capabilities, functions, and services — and name the owners
Reflect the Organization Unit owns Functions and Organization Unit owns Business Services matrices (same source). A practical habit: write “service name + owning organization” inside every box.
Step 5: Map to logical technology components
The UNICOM guidance frames the “global look” a BFD must deliver in three statements:
who owns or governs your Business Functions, Services, and Goals / how your Business Functions, Services, and Goals are implemented on Logical Technology Components / how your Logical Technology Components are related to Physical Technology Components
(UNICOM System Architect)
If a reader cannot extract all three from your diagram, the artifact is incomplete.
Step 6: Descend to physical components and locations
Move from logical (ERP, SRM, MDM) to physical (S/4HANA 2023 Private Edition, SAP Ariba, SAP MDG). On global programs, color-coding the Location layer to show what is deployed where feeds directly into rollout discussions.
Step 7: Review, then feed gap analysis
Phase B includes the steps Develop Baseline, Develop Target, Perform Gap Analysis, Define Candidate Roadmap Components, and Conduct Formal Stakeholder Review (QualiWare Center of Excellence, TOGAF 9.1 Phase B). The disciplined approach is therefore two diagrams — Baseline and Target — with the delta converted into candidate roadmap components.
Drafting Rules That Hold Up in Practice
- Fit the diagram on one A3 sheet or one projected screen; if it is unreadable when scaled, cut a layer
- Cap the number of boxes (seven to nine per layer)
- Give color exactly one meaning (for example, blue = retain, orange = new, gray = retire)
- Minimize crossing lines; unavoidable crossings usually signal the wrong layer structure
- Always include a legend plus date, version, scope, and owner
4. OUTPUT: What You Get and Where It Is Used
Direct Deliverables
| OUTPUT | Content | Primary audience |
| Baseline BFD | Current chain from goals to systems | CIO, business unit heads |
| Target BFD | The same chain in the target state | C-suite, steering committee |
| Gap register | Delta between the two views (new / change / retire) | Programme manager |
| Candidate roadmap components | Gaps bundled into initiatives | PMO |
| Traceability table | Goal → Capability → Service → Component | Architecture board, audit |
The BFD also lands in the Architecture Definition Document. Phase B step 8.4.9 calls for the business sections of the ADD to include “a business footprint (a high-level description of the people and locations involved with key business functions)” (QualiWare CoE).
Where to Use It
- Building executive consensus. Exactly the role the definition assigns it: a communication platform for senior-level stakeholders (The Open Group).
- Presenting scope and impact. A separate Open Group resource frames the purpose as “to provide an overview of scope and impact” (The Open Group, Architecture Toolbox).
- Justifying investment. Answering “which goal does this module actually serve?” on a single page.
- Validating requirements realization. Showing how the target architecture realizes key business requirements; in ArchiMate this maps to the Requirements Realization viewpoint (The Open Group, ArchiSurance Case Study).
- Structuring end-to-end domains. Published templates cover Order-to-Cash and supply chain management (SlideShare, TOGAF 9 template business footprint diagram).
Usage Across the ADM Phases
| Phase | How the BFD is used | Source |
| Phase A | Supplies goals and drivers — the raw material for the top row | SAP Learning |
| Phase B | The build itself: Baseline/Target descriptions, gap analysis, stakeholder review, ADD inclusion | QualiWare CoE |
| Phase C / D | Hands over the function-and-service to logical to physical component linkage | UNICOM System Architect |
| Requirements Management | Reused as a validation view for requirements realization | ArchiSurance Case Study |
One caveat: reusing the BFD in Phases E and F (Opportunities and Solutions, Migration Planning) is common in practice, but no explicit provision for that use could be confirmed in the TOGAF® standard. Where standards compliance is being asserted, it is safer to say you are “referencing the Phase B artifact in Phases E and F.”
5. Worked Example: Global Procurement and Product Cost Transformation at an Automotive Tier 1
Setup
- Subject: automotive components Tier 1 with roughly USD 2.7 billion in revenue; sites in Japan, the US, Mexico, Thailand, and the Czech Republic
- Transformation theme: centralizing global procurement and making product cost visible
- ADM position: Phase B, building the Target BFD
Target BFD Structure (Four Layers Plus Locations)
Layer 1: Strategic Goals
| Goal | KPI | Accountable organization |
| G1 Reduce direct material cost | Direct material unit price −3% YoY | Global Procurement Division |
| G2 Make product cost visible | Monthly cost close at D+3 (currently D+10) | Finance Division, Production Control |
| G3 Reduce supplier risk | Single-source item ratio 30% → 15% | Global Procurement Division |
Layer 2: Business Capabilities
- C1 Strategic sourcing (G1, G3)
- C2 Supplier management and evaluation (G3)
- C3 Procurement operations (G1)
- C4 Standard costing and variance analysis (G2)
- C5 Material and supplier master data governance (G1, G2, G3)
Layer 3: Business Services (with owners)
| Service | Owner | Supporting capability |
| S1 RFQ and quotation comparison | Head of Procurement Planning | C1 |
| S2 Supplier onboarding | Head of Supplier Quality | C2, C5 |
| S3 Purchase order and goods receipt posting | Site purchasing managers | C3 |
| S4 Monthly costing and variance reporting | Head of Cost Management | C4 |
| S5 Master data registration and approval workflow | MDM owner (Corporate Planning) | C5 |
Layer 4: Solution Components (logical → physical)
| Logical | Physical | Services supported |
| Sourcing / SRM | SAP Ariba Sourcing, Supplier Management | S1, S2 |
| ERP (procurement, inventory, costing) | SAP S/4HANA Private Edition | S3, S4 |
| Master data governance | SAP MDG (material, supplier) | S5 |
| Process intelligence | SAP Signavio | Improvement monitoring for C3 |
| Integration / identity | SAP BTP Integration Suite, Cloud Identity Services | All services, cross-cutting |
Location Layer
| Site | S/4HANA | Ariba | MDG | Notes |
| Japan (HQ) | Wave 1 | Wave 1 | Wave 1 | Template-defining site |
| United States | Wave 2 | Wave 1 | Wave 1 | Retires existing legacy |
| Mexico | Wave 2 | Wave 2 | Wave 1 | Cuts over with the US |
| Thailand | Wave 3 | Wave 2 | Wave 1 | Local BOI requirements |
| Czech Republic | Wave 3 | Wave 3 | Wave 1 | EU tax requirements |
The Debates This Single Page Triggers
- What the color-coding exposes. Only S5 (master data registration) is Wave 1 across every site — making it self-evident from the diagram that MDG sits on the critical path for the whole programme.
- Testing traceability. G2 (cost visibility) is supported by S4 and C4 alone. That thinness becomes visible, and underinvestment in the costing domain reaches the executive agenda.
- Detecting missing ownership. S3 is owned by “site purchasing managers” — meaning there is no global owner. Applying the standard’s ownership requirement surfaces an open governance design item.
- Gap to roadmap. The delta against the Baseline BFD (seven site-specific legacy systems) becomes the candidate initiative list for Phase E as it stands.
Baseline-to-Target Gap Register Template
| # | Object | Baseline | Target | Type | Goals affected | Rough effort |
| GP-01 | Purchasing systems | Five site-specific systems | S/4HANA + Ariba | Replace | G1, G3 | High |
| GP-02 | Material master | Site-specific, 30% duplication | Centralized in MDG | New | G1, G2 | Medium |
| GP-03 | Costing | Excel plus manual monthly effort | S/4HANA actual costing | Change | G2 | Medium |
| GP-04 | Supplier evaluation | Not in place | Ariba SLP | New | G3 | Low |
6. Review Checklist You Can Use As Is
- Five goals or fewer, each with a KPI and an accountable organization
- The top-down hierarchical relationship is intact
- Every business service has a named owner
- No orphan components that link to no goal
- No orphan goals that no component supports
- The logical-to-physical component mapping is readable
- Baseline and Target versions exist as a pair
- Legible on one screen or one A3 sheet
- Legend, version, scope, date, and approver are all recorded
- No process detail or interface specifications have crept in (key facts only)
7. Summary
The value of a Business Footprint Diagram lies not in how attractive the drawing is, but in its ability to prove on a single page that the chain from business goal to technical component is unbroken. What the standard demands is traceability, ownership, and ruthless reduction to key facts (The Open Group). Lock down the input catalogs and matrices first, assemble the view in seven steps, then convert it into gaps using a Baseline and Target pair. Once you have this pattern, your Phase B output stops being something you produce and shelve, and becomes the document investment decisions are made from.
Reference Links
- The Open Group, Artifact: Business Footprint Diagram
- The Open Group, TOGAF Standard — Architecture Content
- The Open Group, Toolbox for Architecture Framework Discussions (PDF)
- The Open Group, ArchiSurance Case Study — Phase B: Business Architecture
- UNICOM System Architect, Creating business footprint diagrams
- UNICOM System Architect, Business Footprint Diagram
- SAP Learning, Defining Business Architecture
- QualiWare Center of Excellence, TOGAF 9.1 Phase B: Business Architecture
- SlideShare, TOGAF 9 template business footprint diagram
Disclaimer
Parts of this article were developed with reference to generative AI suggestions and were reviewed, refined, and supplemented based on the author’s professional expertise and judgment.

Leave a Reply