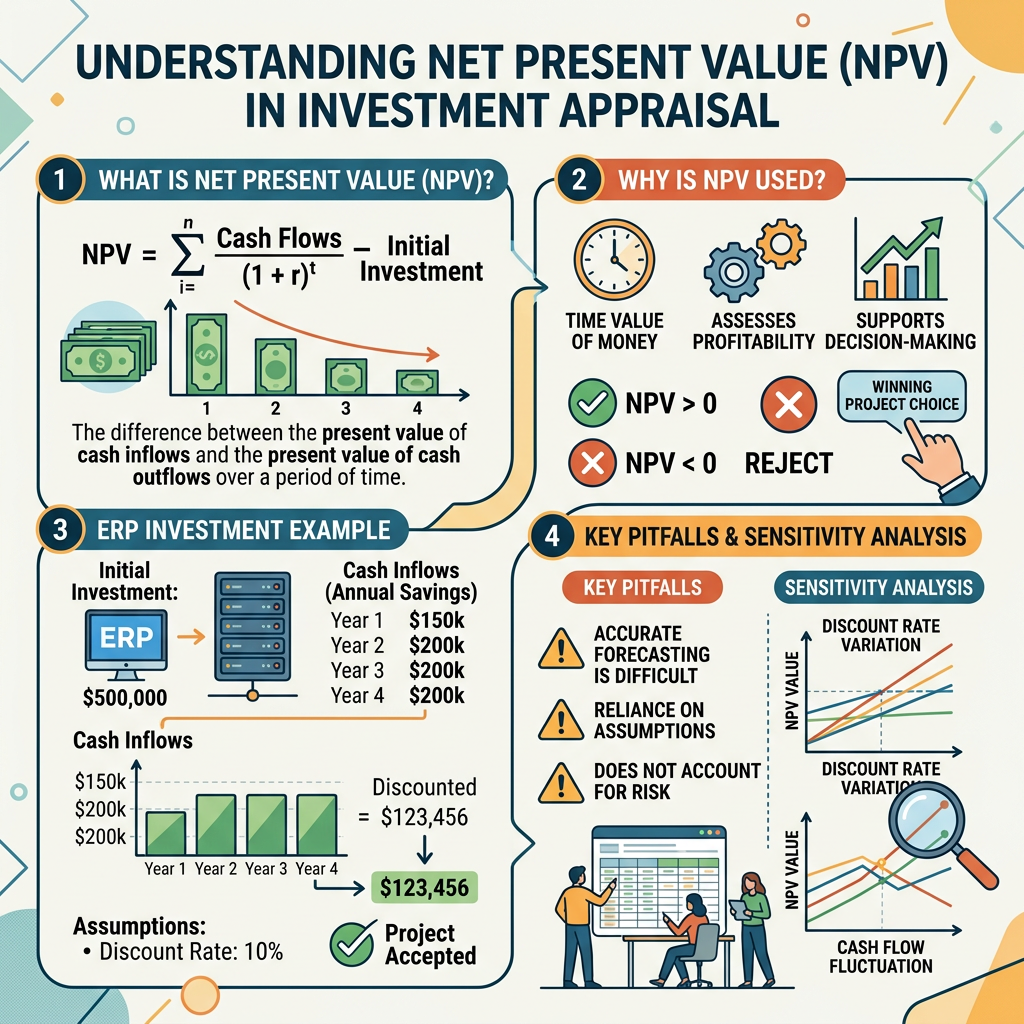
For large-scale IT investments such as ERP or digital transformation programs, you are expected to prove in numbers, in front of the approval board or investment committee, that the investment is genuinely worth making. The metric most often used to make that case is NPV (net present value).
This article walks through the core concept of net present value, why it is so widely used in investment appraisal, and the pitfalls to watch for in practice. It then applies NPV to an ERP implementation, showing step by step how to calculate it and how to run a sensitivity analysis.
What Is Net Present Value? Converting Future Cash into Today’s Value
The Starting Point: The Time Value of Money
NPV rests on a simple idea: one dollar (or one yen) today is worth more than one dollar a year from now. Money you hold today can be invested or put to work immediately, so it can grow to more than its original amount within a year.
For example, at a discount rate of 3%, 100 received one year from now is worth about 97.1 today, and 100 received two years from now is worth about 94.3. Converting future money into its present-day equivalent in this way is called discounting.
Definition and Formula
Net present value is calculated by discounting the cash flows (CF) an investment is expected to generate to their present value, adding them up, and then subtracting the initial investment.
NPV = Σ [ CFt ÷ (1 + r)^t] − Initial investment
| Symbol | Meaning |
| CFt | Net cash flow in year t (investment benefits minus operating, maintenance, and other running costs) |
| r | Discount rate, typically the company’s cost of capital, WACC (weighted average cost of capital) |
| t | Year number (year 1, year 2, and so on) |
How to Interpret the Result
| NPV result | What it means | Decision |
| NPV > 0 | The investment creates more value than it costs | Worth investing |
| NPV = 0 | The investment exactly recovers the cost of capital | No value created or destroyed |
| NPV < 0 | The investment fails to recover its cost | Not worth investing |
The discount rate at which NPV equals exactly zero is called the IRR (internal rate of return). If the IRR exceeds the cost of capital, the investment is considered worthwhile.
Four Reasons NPV Is Widely Used in Investment Appraisal
1. It Captures the Time Value of Money
A benefit of 100 million has a different value depending on whether it arrives in year 2 or year 5. NPV reflects that difference in the numbers. A simple “total benefits minus investment” calculation hides it entirely.
2. It Is Largely Unaffected by Accounting Policies
NPV is based on cash flows rather than accounting profit. As a result, it is less sensitive to differences in accounting treatment, such as depreciation methods, which makes it easier to compare investments on their true economic value.
3. It Builds Risk into the Discount Rate
Using WACC as the discount rate lets you factor both the cost of capital and business risk into the evaluation. The riskier the investment, the higher the discount rate you apply, and the more rigorously future benefits are tested.
4. It Expresses Value as a Monetary Amount
NPV tells you, in currency terms, how much an investment will add to the value of the business. That makes it intuitive for executives and useful when comparing investment proposals with different conditions.
Worked Example: Calculating the NPV of an ERP Investment
Assumptions
The following hypothetical ERP implementation is used for the evaluation:
- Initial investment: JPY 500 million (spent in year 0)
- Discount rate (WACC): 8%
- Evaluation period: 5 years
- Benefit ramp-up: because the business needs time to adopt the new processes after go-live, benefits are assumed to grow gradually
Results
| Year | Net CF (JPY million) | Discount factor 1 ÷ 1.08^t | Present value (JPY million) |
| 0 | -500 | 1.000 | -500 |
| 1 | 50 | 0.926 | 46 |
| 2 | 150 | 0.857 | 129 |
| 3 | 200 | 0.794 | 159 |
| 4 | 200 | 0.735 | 147 |
| 5 | 200 | 0.681 | 136 |
| Total | Simple sum: +300 | — | NPV: +117 |
On a simple undiscounted basis, the benefits exceed the investment by JPY 300 million. Once the time value of money is taken into account, however, the NPV shrinks to JPY 117 million. Because the NPV is still positive, the investment is worthwhile under these assumptions.
Sensitivity Analysis: How NPV Responds When Assumptions Change
NPV can shift dramatically depending on the underlying assumptions. To test this, change the key assumptions one at a time and check the result. This is known as sensitivity analysis.
| Scenario | NPV (JPY million) | Decision |
| Base case (8% discount rate) | +117 | Worth investing |
| Discount rate raised to 12% | +47 | Worth investing (with a thinner margin) |
| Benefits 30% lower | -68 | Not worth investing |
| Benefits delayed by one year | -55 | Not worth investing |
The key takeaway is that, in ERP investments, the timing of benefits drives NPV just as much as their size. A delayed go-live or slow user adoption alone can push the NPV into negative territory. Alongside the investment decision itself, you need an implementation plan and adoption measures that deliver benefits reliably and early.
Pitfalls to Watch When Using NPV
The Quality of the Inputs Determines the Result
NPV depends on only three variables: cash flows, the discount rate, and the evaluation period. Because the formula itself is so simple, optimistic benefit estimates can make almost any NPV look positive. Keep benefit estimates conservative and state every assumption explicitly.
Use a Discount Rate That Matches the Risk
It is not appropriate to evaluate a new business with a different risk profile from the core business using the core business’s cost of capital. For new ventures and highly uncertain investments, set a discount rate that reflects the actual risk.
Count Changes in Cash, Not Accounting Profit
Costs should be captured as TCO (total cost of ownership), covering not only the initial implementation but also operations, maintenance, training, and data migration. As a rule, calculate the incremental cash flow compared with the “do nothing” case, such as extending the life of the current system.
Use IRR Alongside NPV When Comparing Projects of Different Sizes
NPV shows the size of the value created, but not how efficiently capital is used. When allocating limited funds across multiple projects, also check IRR, which measures investment efficiency.
Present Hard-to-Quantify Value Separately
Strategic benefits such as risk reduction, future scalability, and building a foundation for data-driven management are difficult to capture in NPV. Calculate NPV using conservative quantitative benefits, and present strategic value as a separate input to the decision. This makes your case more credible.
State the Evaluation Period and Terminal Value Explicitly
NPV changes significantly depending on whether you evaluate over 5 years or 10 years. Whether the value beyond the evaluation period (terminal value) is included should also be stated as an assumption.
Keep the Initial Investment Outside Excel’s NPV Function
Excel’s NPV function treats every cash flow passed to it as occurring at the end of a period. For that reason, the initial investment made in year 0 (at the beginning of the first period) should not be included in the arguments; add it to the function’s result instead.
Example: =NPV(8%, Year 1 CF:Year 5 CF) + Year 0 initial investment (as a negative value)
If you include the initial investment in the arguments, it is also discounted by one year, which overstates the NPV.
Conclusion
Net present value converts future cash flows into today’s value and compares them with the investment, showing in monetary terms how much an investment will add to the value of the business. Because it reflects both the time value of money and risk, and is largely unaffected by accounting policies, NPV is widely used to evaluate major IT investments such as ERP.
At the same time, NPV is highly dependent on its assumptions: the benefit estimates, the discount rate, and the evaluation period. In practice, rather than presenting NPV as a single number, it is essential to present it together with a list of assumptions and a sensitivity analysis. This allows decision-makers to see exactly which assumptions would break the investment case if they failed to hold, and it clarifies the KPIs that must be tracked after go-live.
References
- Net Present Value (NPV): What It Means and How to Calculate It – Investopedia
- NPV vs. IRR: Key Differences – Investopedia
- Net Present Value (NPV) – Corporate Finance Institute
- NPV Function – Microsoft Support
- Go with the Cash Flow: Calculate NPV and IRR in Excel – Microsoft Support
Disclaimer
Parts of this article were developed with reference to generative AI suggestions and were reviewed, refined, and supplemented based on the author’s professional expertise and judgment.

Leave a Reply